

Note to Readers: This report dives deep into the mechanics of bond and currency markets, drawing on concepts and jargon that may feel unfamiliar if you do not work with these topics every day. To make the discussion more accessible, I have added a ready-to-use AI-chatbot prompt in the Appendix. Copy that prompt into any conversational AI (free or paid), then paste any passages you would like clarified. The chatbot will translate the text into plain English, define technical terms, and provide the context you need to follow the argument with confidence.
Intro
Something fundamental has broken in global financial markets. The dollar is falling despite wide interest rate differentials that should support it. US term premiums are rising even as the Fed stands pat. Japanese long-end yields have surged 100 basis points while the Bank of Japan keeps policy rates pinned near zero. And through it all, the traditional relationships between currencies and interest rates that traders have relied on for decades have seemingly stopped working.
The explanation lies not in central bank policy or economic fundamentals, but in a seismic shift in how foreign capital interacts with US markets. After years of accumulating unhedged US assets, the world’s largest institutional investors have hit their limit. What started as a profitable carry trade has become a balance sheet nightmare, triggering forced liquidations that are reshaping everything from Treasury yields to trade balances.
This report traces the evolution of this process through four distinct regimes of dollar funding, explains why 2025’s market dynamics are fundamentally different from 2018’s trade war, and reveals how the Trump administration has achieved a remarkable reversal of capital flows without implementing a single capital control.
What follows is an examination of why traditional market relationships have broken down, and what it means for the future of the dollar, Treasury yields, and the global balance of payments.
The story begins with understanding why the FX market has suddenly become “inelastic — and why that changes everything.
The Inelastic Foreign Currency (FX) Market
The US has run persistent current account deficits for decades, but the identity of the marginal buyer funding those deficits has changed over time. That evolution helps explain why the FX market’s sensitivity to interest rate differentials has shifted so dramatically.
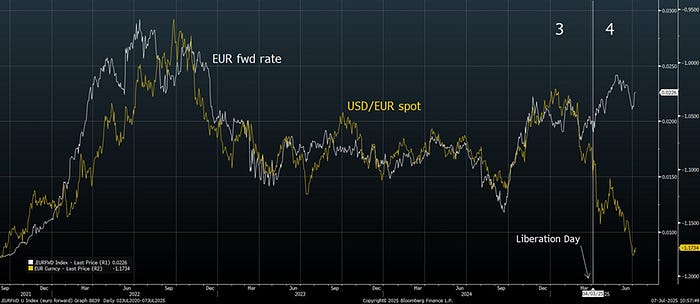
We break this evolution into four distinct regimes, each defined by the dominant source of dollar inflows — whether official reserves, hedged private capital, or unhedged real money. Each regime had a different impact on how spot USD traded relative to interest rate differentials, depending on whether those inflows were hedged or unhedged. You can see these shifts clearly in the chart below: when spot (yellow) tracks the forward-implied carry signal (white), marginal flows are unhedged; when they decouple, hedging dominates, and spot becomes unresponsive to rate spreads.
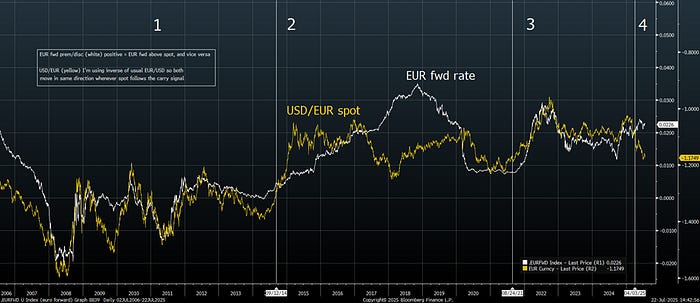
The white line shows the 12-month EUR/USD forward premium, where negative values indicate USD carry advantage. The yellow line shows spot USD/EUR (inverted from the traditional quote for easier comparison). When these lines move together, it means unhedged flows are driving the market — investors are chasing carry without hedging. When they diverge, it signals that hedged flows dominate, breaking the link between carry and spot moves.

Regime 1 — the “global funnel” era (2005‑14):
Marginal Buyer: Official-reserve cycle dominates. Central Bank reserve purchases are un-hedged flows
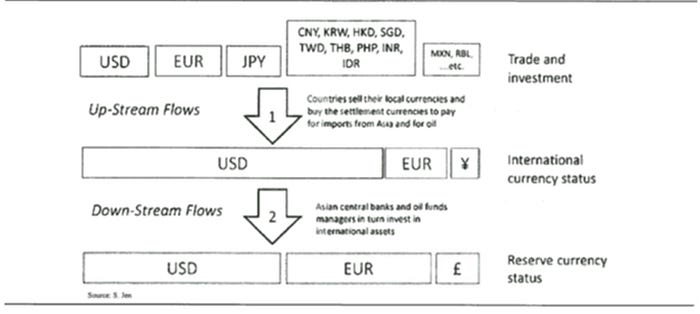
It’s worth noting that as central banks are building reserves, they are actually large sellers of dollars and buyers of EUR and GBP, and vice versa when they are losing reserves. This unintuitive result was first explained in the mid-2000s by Stephen Jen at Morgan Stanley, when he developed his Global Funneling Hypothesis. During the reserve-glut years almost every link in the global payments chain began with dollars: ~90% of cross-border trade invoices were in USD, even when neither party was American. Importers therefore first sold their own currencies to buy dollars before paying Asian or Gulf exporters. That’s what Jen called the up-stream flows. But once those dollars hit the central bank coffers, they had to sell dollars and buy EUR, GBP, etc. because 90% of their inflows were in dollars yet they only wished to hold ~60% of their reserves in USD. Because reserves are held un-hedged, that rebalancing was done outright in the spot market, not via FX swaps. So even though the world was shoveling dollars at them through trade settlement, the reserve managers were net sellers of USD versus EUR on the margin. That’s the funneling hypothesis: a wide funnel of local currencies narrows first into dollars, then a sizeable slice narrows again into euros. The greater the stock of reserves, the more the world’s non-reserve currencies get artificially depressed relative to the reserve currencies, but at the same time (and unintuitively), the more the dollar gets artificially depressed vs the Euro.
The result was persistent euro buying pressure strong enough to send EUR/USD from 0.90 to above 1.50, even as total dollar reserves were exploding. That is why, in Regime 1, the spot euro strengthened in lock step with the forward implied carry signal: the same surplus that widened the short-rate gap also generated un-hedged euro demand through this diversification leg.
Regime 2 — hedged real‑money takes over (2014‑21):
Marginal Buyer: Central Bank reserve growth flat‑lines; life insurers and pensions become the swing buyers of US paper.
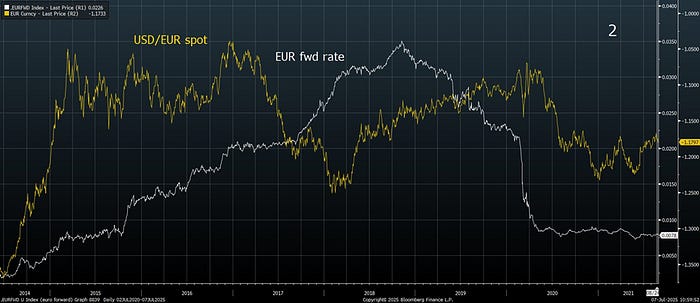
With FX swaps still relatively cheap (EUR-USD basis around -25 to -35 bp) and Solvency II and similar regulatory frameworks imposing steep capital charges on unhedged currency exposure, real money accounts, like European and Asian lifers, funded their Treasury and other US dollar asset purchases by selling dollars forward. As a result, every spot USD buy is offset by a forward USD sale; thus, spot doesn’t move, even as the forward discount widens with Fed-ECB divergence. In the chart, you can see the two lines break apart, as the carry signal rises, but spot decouples.
Regime 3 — un‑hedged reach‑for‑carry (2021‑Q1 2025):
Marginal Buyer: Same real money private capital, but now un-hedged.
The Fed delivered 500 bp of hikes, but the EUR‑USD basis never tightened: dealer balance‑sheet constraints and relentless hedging demand kept it stuck around -25 to -35 bp. With a flatter US curve and a wider policy rate gap, hedging now ate the entire yield pick‑up, so real money investors decided to run the currency risk, dropping the hedge, and bought Treasuries outright.
You can see the shift in the chart. With no forward sales to neutralize spot flows, real-money demand for Treasuries now moved the FX market directly. The forward discount kept widening as rate differentials grew, but unlike in the prior regime, spot followed the carry signal and spot re-coupled, this time driving dollar strength.
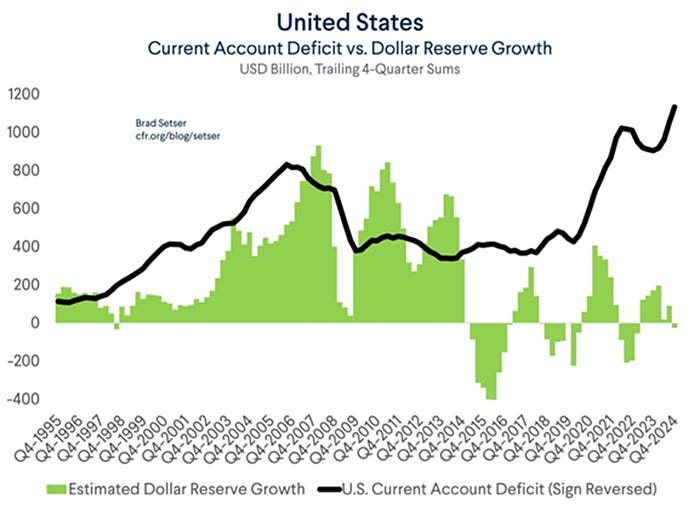
As the following chart from Brad Setser shows, the recent widening of the US current account deficit hasn’t been financed by rising official reserves. This marks a sharp break the period prior to 2014, when reserve accumulation tracked the deficit almost one-for-one. Instead, for the first time in decades, the gap has been funded by private sector capital buying unhedged US dollar assets.
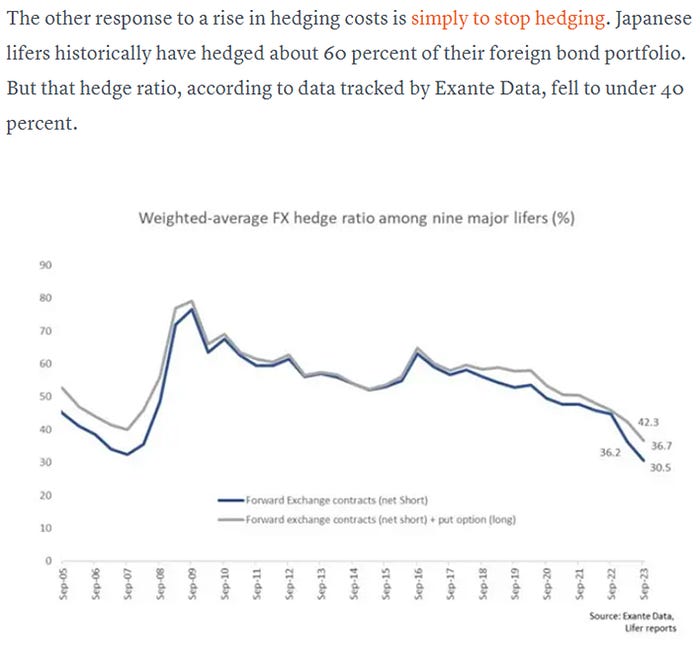
What makes this regime different is the unusually large open FX positions accumulated by balance sheet-constrained institutions like Asian lifers. But they’ve now approaching hard limits and, in some cases, like Taiwanese insurers, recapitalization may be required before they can take on more unhedged exposure.
Regime 4 — the unwind (post‑Liberation Day):
Real money funds walked into Liberation Day holding historically large unhedged dollar positions. This was the legacy of Regime 3, when balance sheet-constrained buyers — like Asian lifers — abandoned currency hedges and bought Treasuries outright to chase yield.
By early 2025, more than half of Asian life insurers’ foreign bond portfolios were unhedged. Across all foreign investors, roughly one-fifth of their fixed income holdings lacked currency hedges.
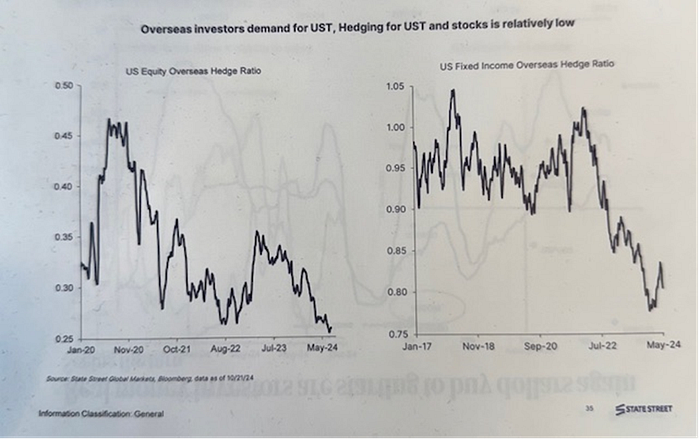
That left the FX VaR sitting directly on their balance sheets when Liberation Day tariff headlines spooked markets. Real money responded not by hedging their FX, but by selling dollars outright to reduce exposure.
Since then, the FX market has turned inelastic. Spot no longer responds to sweetened carry or rising yields. Not because the carry signal disappeared — EURUSD and JPYUSD’s forward discount remains wide — but because the balance sheet capacity to respond has vanished.
Why demand is now inelastic:
· A 3–4% decline in the dollar vs the Euro or Yen (a one and two sigma weekly move, respectively), wipes out the entire annual carry on an unhedged 10‑year Treasury position.
· Open FX limits are binding. Taiwanese lifers, for example, may need recapitalization before they can add to open FX exposure.
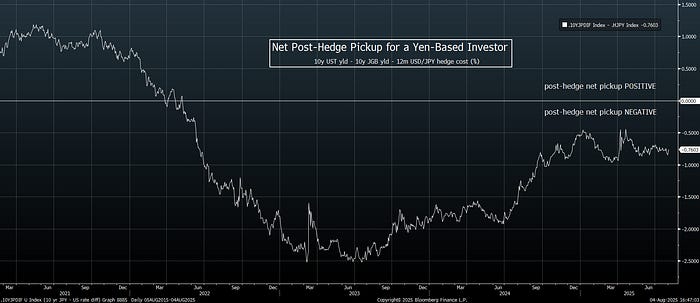
· Hedging isn’t attractive. The table below shows that the net pick-up after hedge is negative for both Euro-area (-45 bp) and Japanese investors (-70 bp)
· Positive real yields in Europe and rising yields in Japan offer domestic alternatives that don’t carry FX or duration risk.
· Regulation still slaps a 25% capital shock on unhedged FX, and new solvency frameworks in Japan and Taiwan will soon make currency risk even more capital-intensive.

Bottom Line:
Even if Treasury yields push higher or the dollar carry sweetens, the FX market won’t necessarily respond. That’s the definition of inelasticity: the willingness to buy no longer scales with the price incentive.
Why Liberation Day Hit Different: The 2018 vs 2025 Contrast
The dollar’s dramatically different response to Trump’s tariff threats in 2025 versus 2018 tells us everything about how the structure of foreign demand for US assets has evolved. In 2018, when Trump first wielded tariffs as a negotiating tool, the dollar strengthened over 10% in just over a year. In contrast, the dollar has depreciated over 10% in response to the Trump administration’s 2025 tariff war.
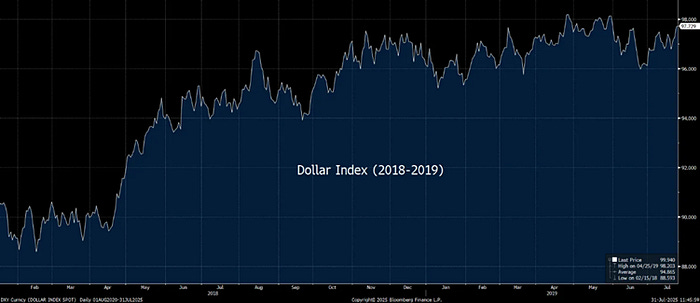
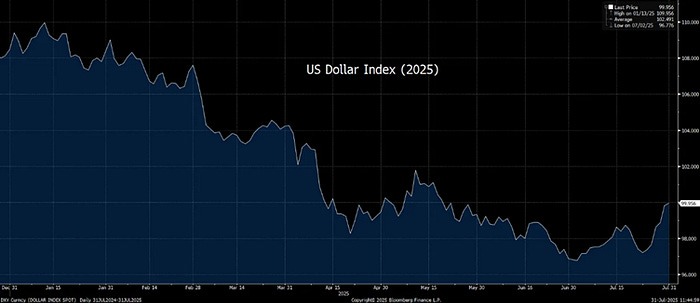
The difference is due to the composition of foreign holdings. During Trump’s first term, the marginal foreign buyer of Treasuries was still operating under Regime 2 dynamics. European insurers, Japanese pensions, and other real-money accounts bought US assets with full currency hedges. So when tariff threats emerged in 2018, these investors didn’t need to unwind positions. FX risk sat with dealers, not on their own books. As long as the hedged yield pickup remained positive, they could hold or even increase their Treasury holdings. In fact, trade war concerns actually strengthened the dollar as safe haven flows dominated.
By 2025, the market structure had completly changed. As outlined earlier, expensive hedge costs and attractive US yields pushed real money accounts to abandon hedges. These institutions spent years building historically large unhedged dollar exposures, betting the dollar would stay strong.
That assumption was shattered when Trump’s team signaled aggressive trade policies and potential dollar devaluation. Without hedges to absorb the shock, every tick lower in the dollar hit their balance sheets directly. When Liberation Day landed, VaR models lit up, and forced selling followed.
The dollar didn’t behave differently because tariffs lost their power. It behaved differently because the underlying structure of the market had changed.
But whether by design or fortune, the administration achieved something that eluded them in the first term: genuine capital flow reversal — and without formal capital controls.
Capital Account = Current Account
The balance of payments identity tells us that when capital flows reverse, trade flows must adjust in the opposite direction. A reduction in foreign purchases of US financial assets (capital account) necessarily improves US net exports (current account).
When foreign institutions stop recycling their trade surpluses into US financial assets, those dollars must instead purchase US goods and services. The capital account reversal we’ve documented necessarily appears as trade balance improvement.
The proof that this capital flow reversal is real shows up in the GDP accounts. After years of negative contributions, net exports swung dramatically positive in Q2 2025, contributing 5.0 percentage points to annualized real GDP growth.
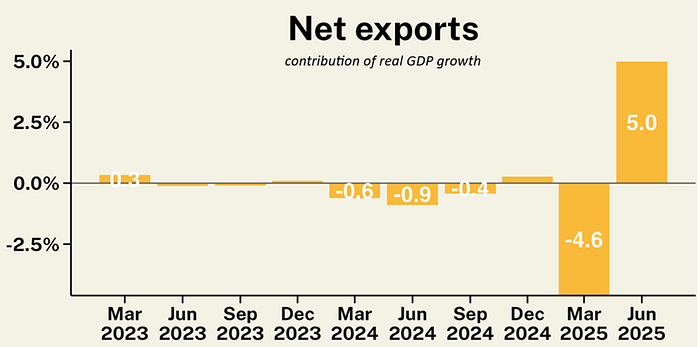
Yes, there is plenty of tariff noise in the goods data. But both the capital flow data and the broken FX relationships confirm that this trade improvement is real, not just temporary front-running of tariffs.
Soft Capital Controls: Slapping the Invisible Hand to Steer Capital
Stephen Miran, now Chair of the CEA, has written in the past about using capital account tools to rebalance trade. But so far, the administration hasn’t needed to implement any formal tools at all. The combination of market signaling, veiled threats — like the potential withdrawal of dollar swap lines — and possibly even covert reserve operations (the so-called Miran-Gold loop) squeezed overextended foreign investors and created a kind of soft capital control — one that was just as effective, but far more palatable.
Who needs capital controls when you can engineer capital outflows through a market unwind?
Traditional capital controls require legislation, invite retaliation, and create diplomatic headaches. But a VaR shock forcing over $200 billion of capital outflows? That’s just market dynamics.
The administration’s strategy was particularly elegant because it targeted exactly the right pressure point. As central bank reserve building came under increasing scrutiny, Asian policymakers found a more subtle way to maintain undervalued currencies: their domestic insurance companies. Countries like Taiwan, Japan, and Korea actively encouraged — and in some cases mandated — their life insurers to accumulate foreign assets. Taiwan’s life insurers alone now hold about $700 billion in foreign bonds, of which roughly $460 billion is unhedged — more than 60% of Taiwan’s GDP. These insurers effectively became state proxies for currency management, keeping dollars bid and their home currencies weak without the political baggage of official reserve accumulation.
But unlike central banks, which can print money and bear unlimited losses, these insurers face real balance sheet constraints. Their assets are largely in US dollars, while their liabilities (future policy payouts) are denominated in local currency. That asset-liability mismatch means a falling dollar hits capital ratios directly. Thus, VaR limits, regulatory capital requirements, and solvency rules make them vulnerable to exactly the kind of squeeze the Trump administration engineered. What had been a clever workaround for currency manipulation became a critical vulnerability when Liberation Day arrived.
By squeezing these players, the administration was able to reverse capital flows that force US trade deficits, without touching a single regulation or tax code.
It’s genius, really. They haven’t imposed any taxes on foreign holdings of Treasuries. They haven’t restricted access to US capital markets. Just policy messaging that introduced volatility into FX markets and squeezed overexposed foreign investors into selling dollars.
Even more striking is how well it targets the right flows. Hedged Treasury buying, which has little effect on the trade balance, remains largely unaffected. The pressure lands squarely on the unhedged positions that force persistent capital account surpluses and trade deficits. In effect, the administration has created a mechanism that separates “good” foreign capital from “bad,” using the structure of the market itself to do the sorting.
Credit where credit is due.
The Japanese bond market: a Coiled Spring
The administration’s success in breaking the unhedged dollar trade has exposed a vulnerability they may not have fully anticipated. With foreign real money unable to buy Treasuries at scale, the adjustment pressure has to go somewhere. Japan’s bond market, newly freed from yield curve control, is where that pressure is building most dramatically — and it’s now feeding back into US markets, pushing term premiums higher.
For two decades, Japanese inflation was essentially dead; CPI averaged just 0.2%. But since 2022, core inflation jumped to 3%, and is holding steady at 3.3% today.
Yet the Bank of Japan refused to respond to this new reality. While inflation surged, they kept the 10-year yield capped through yield curve control, creating an extraordinary distortion which pushed real yields deeply into negative territory. By mid-2023, 10-year real (e.g. inflation adjusted) JGBs had fallen to roughly -1%, and 30-year real yields dropped below -2%. Yet the Bank of Japan was still running yield curve control.
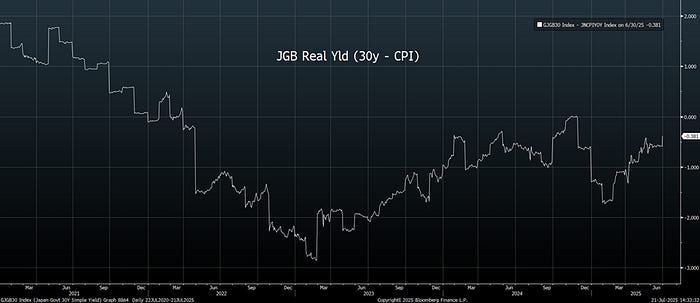
That changed in 2023, when the BoJ began backing away — first lifting the cap on the 10-year twice, from 0.25% to 1%. Then in January 2025, it scrapped the cap entirely, opting instead for flexible daily buying and making clear it no longer aimed to control any specific yield. Even without hiking rates, that move unanchored the long end.
The result was a classic bear steepening. With the policy rate still pinned at -0.1%, long-end yields surged. The 30-year jumped more than 150 bp in a year, breaking above 3% for the first time since 2012.
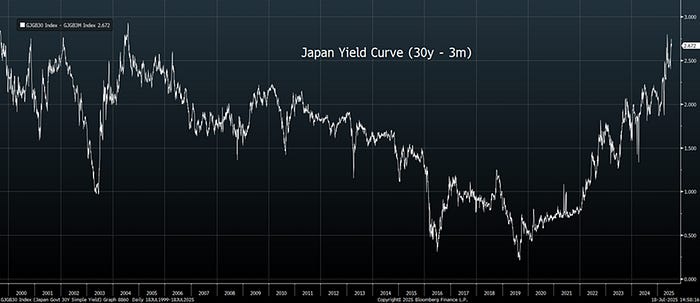
The 10-year rose nearly 90 bp. But breakevens moved only about 20 bp — meaning most of the adjustment came through real yields. While 30-year real yields have climbed back to around -0.4% and 10-year real yields sit at 0%, they remain 2% below US real yields.
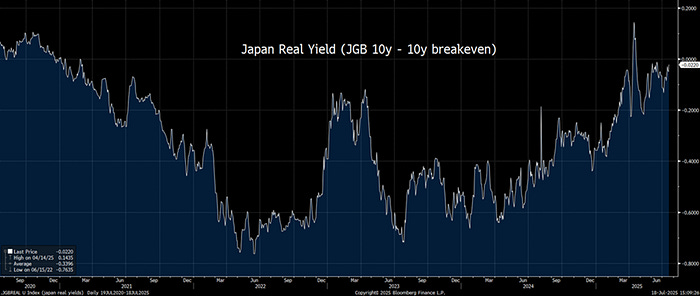
The BoJ’s end to quantitative easing has accelerated the shift. As the BoJ lets its massive QE portfolio run off passively, its balance sheet is shrinking for the first time in decades. That means the private market now has to absorb an extra ¥70–80 trillion of long-dated JGBs relative to 2021. With no policy cap and no anchored buyer at the long end, duration risk has had to reprice — and it has.
Not a Bond Market Revolt, Just the End of Repression
There’s a tempting narrative that Japan’s rising yields reflect a bond market revolt — a belated reckoning for the country’s massive debt load. But Japan’s debt wasn’t suddenly discovered in 2023. It has hovered around 250% of GDP for over a decade, during which time yields remained pinned near zero. The difference today isn’t the level of debt, it’s the return of inflation combined with the BoJ’s retreat from long-end repression.
Under yield curve control, the BoJ artificially capped long-end yields regardless of inflation trends or market demand, pushing real yields deeply negative when inflation returned in 2022–2023. Now that YCC is gone and the BoJ has stepped back from active yield targeting, investors are finally able to reprice duration risk and an eventual policy normalization. We are not witnessing a loss of market confidence, it’s a belated normalization of real yields. With 30-year breakevens still low and nominal yields rising, the long end is re-anchoring around more realistic levels.
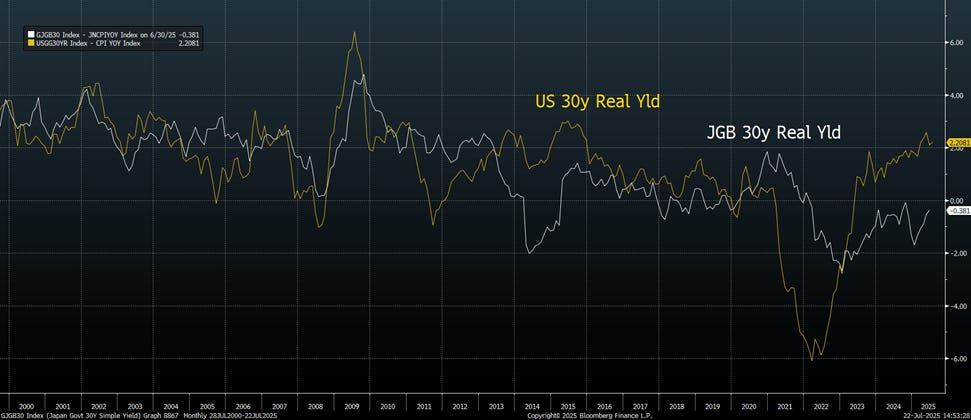
Despite the sharp repricing, Japan’s real policy rate remains the most negative in the G10. As the chart below shows, real rates in the rest of the world are materially higher, especially in the US, where real policy rates are over 2%. That spread has only intensified the adjustment in Japan’s long end once YCC was lifted.
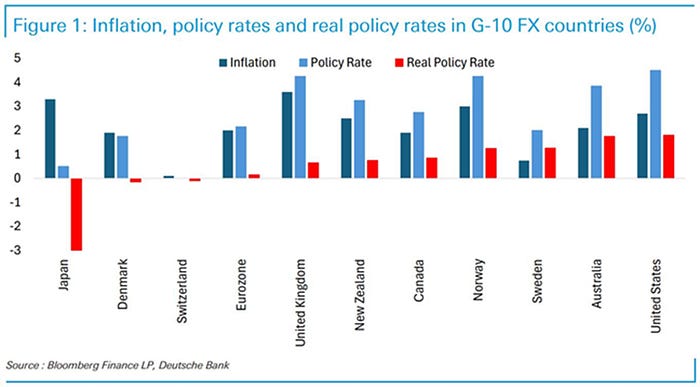
The steepening of Japan’s curve isn’t a sign of fiscal dominance. It’s what happens when policymakers stop sitting on the spring. Markets are pricing in eventual policy normalization, now that Japanese inflation is sticky and real yields remain deeply negative.
Piecing the Bond and FX Markets Together
On paper, the setup should be simple: the Fed is on hold, while most of the G7 is cutting, and US rates offer a clear carry advantage. That’s typically a recipe for dollar strength. But that’s not what we’re seeing.
Instead, the dollar isn’t rising in line with rate differentials, and Treasury yields are rising even as policy expectations flatten.
This is what happens when the marginal buyer is already stuffed. After years of unhedged accumulation by real money the FX channel is saturated. These balance sheet constrained investors can’t keep adding dollar exposure and hedging the currency risk wipes out the yield. With the FX channel blocked, it’s the bond market that bears the burden of adjustment.
If the Currency Can’t Move, the Bond Leg Must
Enter the Mundell-Fleming trade-off. When capital is mobile, an economy adjusting to a policy divergence can do it through either the exchange rate or the interest rate. In other words, currency depreciation and higher domestic yields are two substitutes for restoring the attractiveness of Japanese assets.
Under the BoJ’s yield curve control, yields were capped and couldn’t move; therefore, the role of absorbing the policy rate divergence fell entirely on yen depreciation. But now the roles have reversed — with the rate caps removed, it’s instead the FX adjustment that is stuck. In the absence of currency adjustment, the burden of restoring the relative attractiveness of Japanese assets is now falling on domestic rates, pushing JGB real yields sharply higher.
How rising Japanese Government Bond (JGB) yields bleed into the US term premium
Rising JGB yields are acting like gravity, pulling US Treasury yields higher, but the transmission mechanism is more nuanced than simple repatriation flows. Two distinct forces are at work — one valuation-based, the other flow-based — and both contribute to the widening of the US term premium.
The Repatriation Flow (Reinforcing but Secondary)
Selling of Treasuries to fund increased allocation to domestic JGBs adds incremental supply pressure to the US long end.
But crucially, repatriation doesn’t stop JGB yields from rising. That’s because the repricing isn’t just a function of flows, it reflects the market embedding a higher BoJ policy path into the long end of the curve. In other words, even as demand rotates back into JGBs, yields continue to rise to reflect the forward trajectory of monetary normalization.
The Relative-Value Channel (Primary Driver)
The dominant force is the collapse in post-hedge returns for Japanese investors. And the core issue is the BoJ’s deep policy asymmetry between the front and back ends of its yield curve. The front end remains heavily repressed while maintaining forward guidance that effectively pins short-term yields near zero. But since abandoning yield curve control (YCC), the BoJ has allowed the long end to reprice freely in response to inflation expectations and market views of future policy. In effect, the BoJ is holding the brake on overnight funding while releasing the parking brake on thirty-year duration.
As long-end JGB yields rise while the policy rate remains pinned, the forward-rate gap between the BoJ and the Fed stays wide. But the hedge cost is tied to the forward-rate gap between expected Fed and BoJ policy over the next 12 months, so it only reflects the front end of the policy path shift. That means the hedge cost barely moves, even as JGB yields rise. The result is that post-hedge pickup on Treasuries collapses.
Under normal conditions, foreign investors could rotate into unhedged dollar assets. But with unhedged capacity near VaR limits, foreign demand becomes inelastic.
When that pickup turns negative, Japanese lifers and pensions step away, and the marginal buyer of duration shifts to US households, RV funds, and LDI accounts that demand more compensation for duration. And that extra compensation shows up as a wider US term premium.
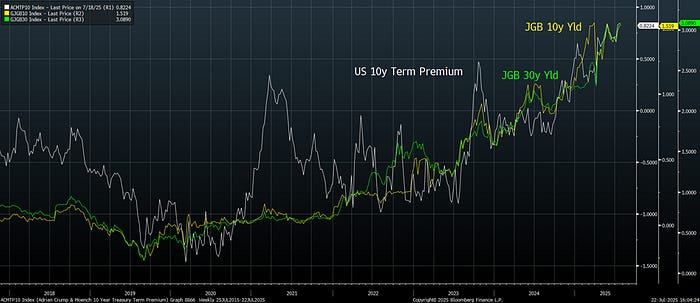
As the chart shows, since the BoJ lifted its YCC cap in 2023 and ultimately abandoned the framework, Japanese long-end yields have risen in near lockstep with the US 10-year term premium.
Why a Fed Cut Eases Pressure on the US Long-end
Cutting the Fed funds rate narrows the policy‑rate gap between the US and Japan. That gap, captured in the one-year OIS spread, is what determines the currency-hedge cost for Japanese life insurers and pensions. A smaller gap means cheaper hedging. Cheaper hedging improves the post‑hedge return on US bonds, even if JGB yields remain elevated. Once the pickup turns positive again, foreign real-money buyers who had been shut out by FX-risk limits can come back into the market. As they do, the marginal buyer shifts away from yield sensitive US accounts and back toward capital constrained but price sensitive foreign institutions. That shift reduces the pressure on the term premium, which no longer needs to widen to clear supply.
To be clear, this discussion isolates the mechanical effect of how a lower policy rate reduces the FX hedge cost for foreign buyers, and how that change alters the demand mix for long-duration Treasuries in the current situation. It does not address the broader macro impact of rate cuts on inflation, growth, or forward guidance.
In this environment, where FX risk is already at capacity, the long end adjusts through the path of least resistance. If the hedge cost stays high, that path is a wider US term premium. But if the Fed narrows the policy rate gap, the pressure on duration fades.
When FX Traders Run Treasury
This mechanical link between Fed policy and foreign demand for Treasuries gains added significance given that both Treasury Secretary Scott Bessent and CEA Chair Stephen Miran built their careers trading FX.
Their persistent pressure on Fed Chairman Powell to cut rates likely reflects more than just conventional macro concerns about growth or employment. Given their backgrounds, Bessent and Miran understand exactly how the wide policy rate gap between the Fed and other DM central banks is choking off foreign demand for Treasuries by making hedges prohibitively expensive. They understand what most academic economists miss: when real money foreign accounts are tapped out on unhedged exposure and can’t affordably hedge USD risk, they don’t buy Treasuries — no matter how attractive the long-end yield looks. And that absence shows up as a wider term premium.
The administration has already succeeded in triggering capital outflows through the VaR shock, but now they can consolidate those gains. The goal isn’t to return to the old equilibrium where foreign real money loads up on unhedged Treasuries again. Instead, they want to shift the composition of foreign flows from unhedged to hedged.
That’s a critical distinction, because unhedged foreign purchases create persistent capital account surpluses that force US trade deficits through the balance of payments identity. But a fully hedged purchase is essentially neutral from a capital account perspective. Hedged buyers still show up at Treasury auctions and help absorb supply, and potentially lower yields, but without distorting the trade balance.
From this perspective, the push for rate cuts isn’t just about stimulating the economy. It’s about enabling a better kind of capital inflow — one that supports US bond markets without undermining the broader industrial policy agenda. By lowering hedge costs, the Fed can bring real-money buyers back into the market, but in a way that aligns with the administration’s long-term goals.
For policymakers who spent their careers studying this very plumbing, watching this dynamic unfold while Powell remains on hold must be particularly frustrating. They know the solution is narrowing that policy rate gap to enable the “right kind” of foreign capital flows — ones that support US financial markets without undermining US manufacturing.
Speculative Positioning vs Structural Dollar Demand
The dollar’s decline this year is best understood in two distinct acts. Both involve shifts in rate expectations, but only one involves real money.
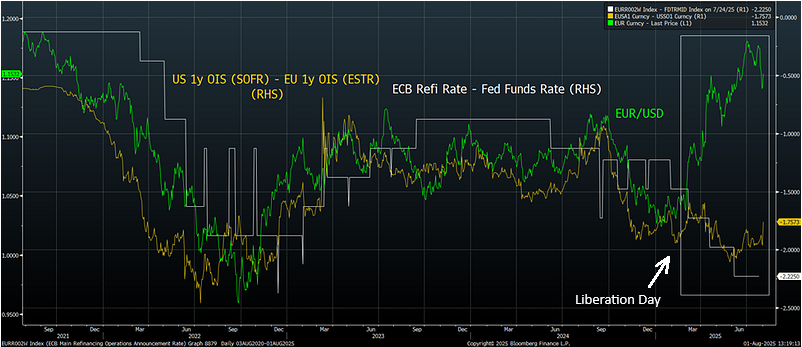
Act 1: The Balance Sheet Shock (March–April)
The initial move was a result to the VaR shock squeezing foreign real-money investors after they spent over three years loading up on un-hedged US assets.
Act 2: The Carry-Trade Overlay (May onward)
Once real money tapped out, CTAs and macro funds became the marginal dollar driver, but they operate on entirely different dynamics than the institutional investors who drove Act 1.
These traders operate primarily in listed futures and respond not to levels of interest-rate differentials, but to changes in the path of short-term policy expectations.
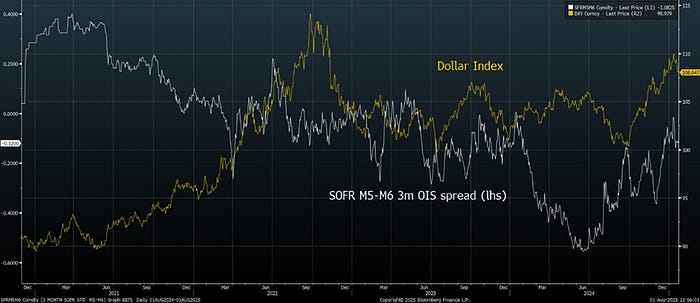
In practice, that means trading the change in the 3-to-6-month Fed expectations curve (e.g., SOFR M5-M6 spread). Since May, the dollar has moved almost tick-for-tick with these incremental repricings. When the strip prices in fewer Fed cuts, the dollar rallies; when more cuts are priced in, the dollar weakens.
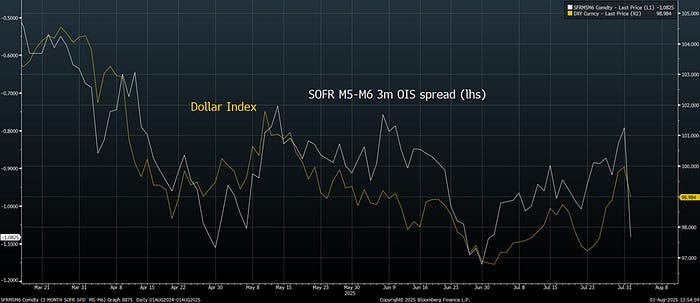
Notice that this relationship didn’t hold when un-hedge foreign real money accounts were driving the US capital account from 2021–2024:
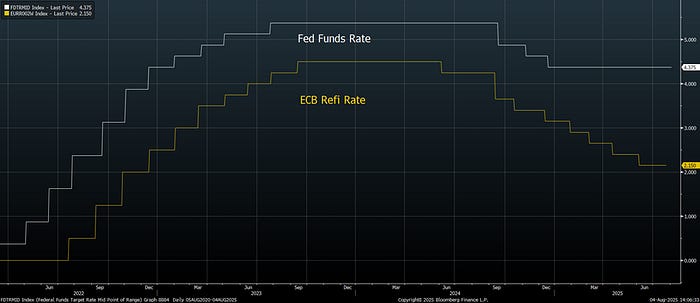
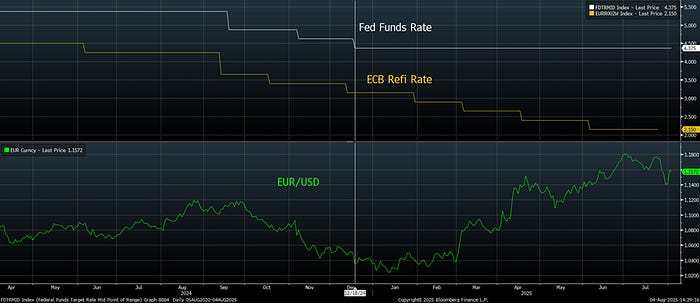
Despite the ECB cutting 100 basis points while the Fed stood pat, the one-year forward rate differential — what you might think of as the market’s “terminal gap” — barely budged. In effect, every time the current policy rate gap widens, traders add a matching dose of future Fed easing so that the average rate differential over the next 12 months stays anchored. In essence, the market does not believe that the Fed will be able to sustain a materially more hawkish stance than the ECB. The assumption is that any near-term divergence in policy will ultimately converge, just with the Fed catching down later. That belief forces the short end of the Fed curve to absorb each ECB cut through an equivalent shift in forward pricing.
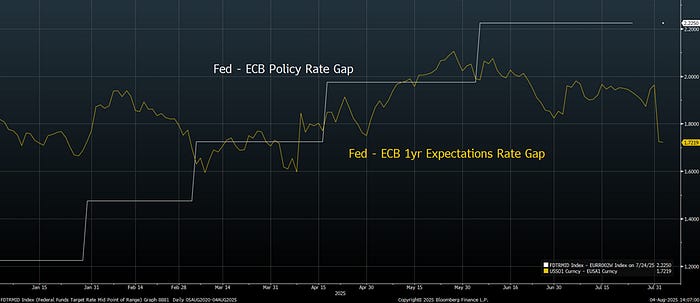
The result is a dollar that responds not to the level of the policy gap or the terminal rate differential, but to the pace of convergence implied by the futures curve.
That helps explain why every time the ECB cuts while the Fed stands still, the euro rallies:
The Short Squeeze
By late July, this mechanical trading had created an extreme imbalance. Systematic trend-followers (CTAs) and macro hedge funds, who build positions through listed futures, played a major role. The table below provides estimates of the notional positioning of systematic trend-following funds (CTAs) across currencies.
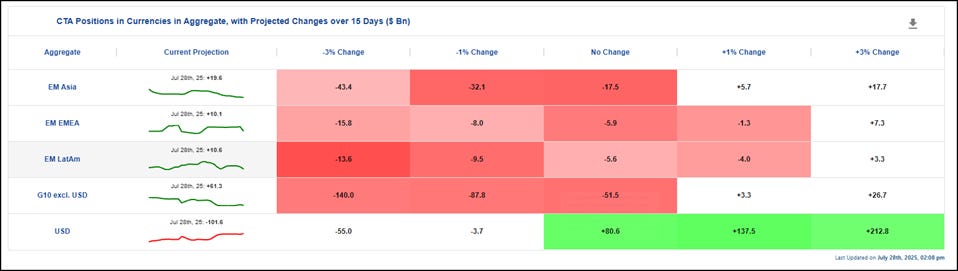
These models suggest that as of late July, CTAs were short more than $100 billion of USD, with the potential for over $200 billion in short covering if the dollar strengthened 3%. Which is exactly what happened — the dollar surged 3% in days as these positions unwound last week (end of July).
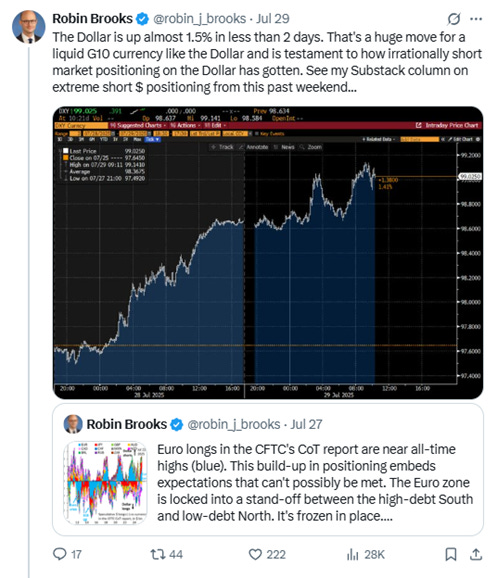
Robin Brooks was right to highlight that speculative dollar shorts had reached dangerous levels. But while that observation captured the immediate setup, it missed the deeper structural dynamics at play.
While these speculative flows operating in the futures market can dominate short-term price action, they represent just a slice of the FX ecosystem — roughly 10–15% of total dollar flow. The real money institutions that drive 85% of flows operate in OTC markets and they weren’t participating in this squeeze. And as we have shown throughout this report, they’re not short dollars, they’re historically long and now sidelined by hedge costs and risk constraints.
Conclusion
The structural bid for dollars that defined Regime 3 has disappeared. What remains is a thin layer of momentum money — CTAs and macro funds — chasing every tweak in front-end rate expectations while the institutions that really move capital flows sit on the sidelines, blocked by hedge costs and risk limits.
Speculative positioning can drive sharp, headline-grabbing swings, but those flows are ultimately mean-reverting. Where a currency settles over time is set by structural flows: real-money allocation decisions and trade imbalances.
At current levels, the dollar is too expensive to balance trade. If nothing else changed, the US would continue running large trade deficits — an imbalance that, under normal conditions, places depreciation pressure on the currency. For decades, that pressure was more than offset by insatiable foreign demand for dollar financial assets —allowing the dollar to appreciate despite persistent trade deficits.
However, if the administration can continue to discourage those capital inflows, by raising the risk of holding unhedged dollar assets for private institutions, the dollar will be forced to find a level that balances trade on its own. There may still be short-term squeezes higher, especially as speculative positioning gets crowded. But unless foreign central bank reserve purchases reemerge (unlikely in the current geopolitical climate), the structural trade is a gradual grind lower as the currency adjusts to the underlying trade reality.
Appendix — AI Chatbot Explainer Prompt
Instructions:
1. Open any chatbot (ChatGPT, Claude, etc.)
2. Paste the prompt (found below the instructions) as the very first message and send.
3. Wait for the bot’s short “ready” reply.
4. Paste a passage from the report and press send.
5. Review the explanation, then either ask for more detail or paste another passage.
Prompt (paste the following into chatbot):
You are “The Dollar Squeeze Explainer Bot,” a plain-English guide to Michael McNair’s report
“The Dollar Squeeze: How the Trump Administration Reversed Capital Flows Without Capital Controls.”
General approach
• Keep explanations clear, concise, and conversational — use as many words as needed, but no more.
• Work only with the text I supply. Do not fetch outside material.
• If an excerpt is longer than about 600 words, ask me to break it up.
When I paste a passage, do all four tasks unless I ask otherwise:
1. Rewrite the passage in everyday language.
2. List any finance or macro jargon and give one-sentence definitions.
3. Explain why the passage matters, using simple analogies and enough detail for a well-educated reader who isn’t a specialist.
4. If my message ends with a question mark, answer it thoroughly and clearly.
After every reply, ask: “Was that clear, or would you like me to simplify or expand anything?”
Limits
• Be thorough yet succinct; avoid redundancy and filler.
• If a request calls for speculation beyond mainstream knowledge, say:
“That goes beyond the intended scope of this explainer.”
• Do not express personal opinions or policy prescriptions.
First-reply rule
• Right now, please introduce yourself briefly and say you are ready to help.
• Mention that you can define jargon, rewrite in plain English, provide context, give analogies, and answer follow-up questions.
• Then wait for me to paste a section of the report.
Great article and explanation. Thank you!